Build monitoring system base on prometheus and grafana
source
install
alertmanager
1wget https://github.com/prometheus/alertmanager/releases/download/v0.24.0/alertmanager-0.24.0.linux-amd64.tar.gz -O alertmanager.tar.gz
2tar -zxvf alertmanager.tar.gz
3cd alertmanager
4#you will see the alertmanager binary and a simple yaml config
5./alertmanager -h
6#show usage of alertmanager
alertmanager.yml
 1route:
 2  group_by: ["alertname"]
 3  group_wait: 30s
 4  group_interval: 5m
 5  repeat_interval: 1h
 6  receiver: "web.hook"
 7receivers:
 8  - name: "web.hook"
 9    webhook_configs:
10      - url: "http://127.0.0.1:5001/"
11inhibit_rules:
12  - source_match:
13      severity: "critical"
14    target_match:
15      severity: "warning"
16    equal: ["alertname", "dev", "instance"]
./alertmanater start alertmanager server on port 9093
node exporter
Prometheus collects variable metrics from variable kinds of exporter
1wget https://github.com/prometheus/node_exporter/releases/download/v1.3.1/node_exporter-1.3.1.linux-amd64.tar.gz -O node_exporter.tar.gz
2tar -zxvf node_exporter.tar.gz
3cd node_exporter
4#you will see the node exporter binary
5./node_exporter
6#start node exporter on port 9100
prometheus
1wget https://github.com/prometheus/prometheus/releases/download/v2.36.2/prometheus-2.36.2.linux-amd64.tar.gz -O prometheus.tar.gz
2tar -zxvf prometheus
3cd prometheus
4#you will see the prometheus binary and a simple yaml config
5./prometheus -h
6#show usage of prometheus
modify your prometheus.yml prometheus.yml
 1# my global config
 2global:
 3  scrape_interval: 15s # Set the scrape interval to every 15 seconds. Default is every 1 minute.
 4  evaluation_interval: 15s # Evaluate rules every 15 seconds. The default is every 1 minute.
 5  # scrape_timeout is set to the global default (10s).
 6# Alertmanager configuration
 7alerting:
 8  alertmanagers:
 9    - static_configs:
10        - targets:
11            - localhost:9093
12# Load rules once and periodically evaluate them according to the global 'evaluation_interval'.
13rule_files:
14  - "first_rules.yml"
15  # - "second_rules.yml"
16# A scrape configuration containing exactly one endpoint to scrape:
17# Here it's Prometheus itself.
18scrape_configs:
19  # The job name is added as a label `job=<job_name>` to any timeseries scraped from this config.
20  - job_name: "prometheus"
21    # metrics_path defaults to '/metrics'
22    # scheme defaults to 'http'.
23    static_configs:
24      - targets: ["localhost:9090"]
25  - job_name: "node"
26    static_configs:
27      - targets: ["localhost:9100"]
first_rules.yml
 1groups:
 2  - name: high_cpu
 3    rules:
 4      - alert: HostHighCpuLoad
 5        expr: 100 - (avg by(instance) (rate(node_cpu_seconds_total{mode="idle"}[2m])) * 100) > 1
 6        for: 0m
 7        labels:
 8          severity: warning
 9        annotations:
10          summary: Host high CPU load (instance {{ $labels.instance }})
11          description: "CPU load is > 80%\n  VALUE = {{ $value }}\n  LABELS = {{ $labels }}"
start a simple web server receives the webhook
1from flask import Flask, request
2app = Flask(__name__)
3@app.route("/", methods=["POST"])
4def index():
5    """docstring for index"""
6    print(request.data, "data")
7    print(request.args, "args")
8    print(request.form, "form")
9    return "ok"
grafana
1sudo apt-get install -y adduser libfontconfig1
2wget https://dl.grafana.com/oss/release/grafana_9.0.0_amd64.deb
3sudo dpkg -i grafana_9.0.0_amd64.deb
4sudo systemctl enable --now grafana-server.service
open you browser open grafana dashboard
login use admin/admin and change your default password
open setting datasource add prometheus datasource
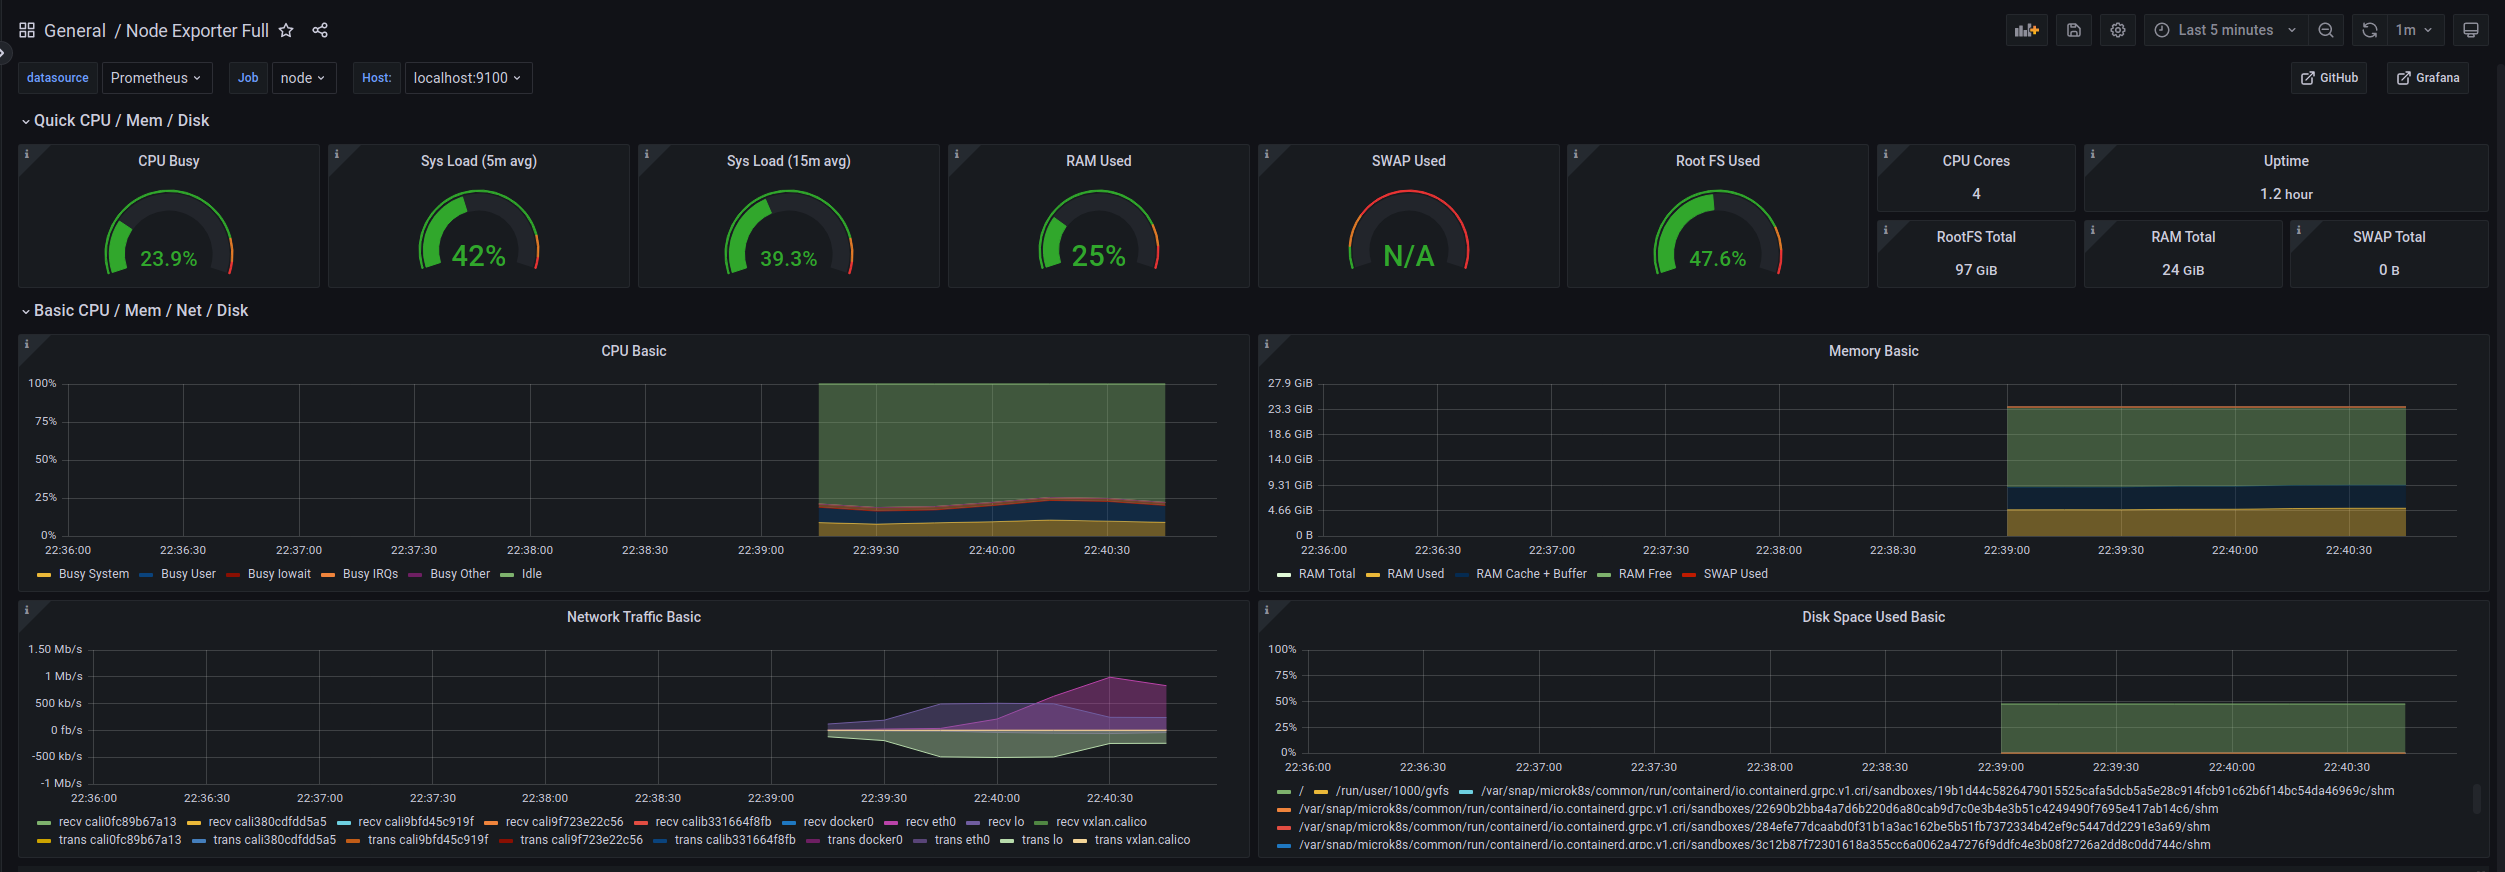
find node dashboard in grafana dashboard market
import dashboard by id 1860