Quickly Deploy Grafana to Kubernetes
Grafana is a cross-platform, open-source tool for metric analysis and visualization, primarily used for querying and displaying collected data.
It provides a wealth of visualization options, including rapidly adaptable client-side charts, panel plugins for visualizing metrics and logs in different ways, and rich dashboard plugins, such as heat maps, line charts, and graphs.
Grafana helps users quickly view and edit the front-end of their dashboards, supporting multiple data sources simultaneously, and is capable of transforming time series database (TSDB) data into stunning charts.
Preparation
- Kubernetes
- Helm
- Postgresql (optional)
- Kubeapps (optional)
Installation
Import Bitnami Repository
1helm repo add bitnami https://charts.bitnami.com/bitnami
2helm repo update
Prepare Chart Values
The complete original values can be viewed using the helm command:
1helm show values bitnami/grafana
Areas to be modified:
 1config:
 2  useGrafanaIniFile: true
 3  grafanaIniConfigMap: "grafana-config"
 4grafana:
 5  # Store additional environment variables, such as database password environment variables
 6  extraEnvVarsSecret: "grafana"
 7  # Change to the desired value, here set to AliCloud
 8  storageClass: "alicloud-disk-available"
 9  # Modify the PV size, AliCloud's minimum is 20Gi, anything smaller cannot be created
10  size: 20Gi
grafana-config
 1apiVersion: v1
 2data:
 3  grafana.ini: |-
 4    [database]
 5    type = postgres
 6    # Change to the actual value
 7    host = "YOUR_PG_HOST"
 8    # Change to the actual database username
 9    name = grafana
10    # Change to the actual database password
11    user = grafana
12    # ConfigMaps are not suitable for storing password-related information. Here, env is used to store the database password, which can be used with extraEnvVarsSecret
13    password  = $__env{PG_PASSWORD}
14kind: ConfigMap
15metadata:
16  name: grafana-config
17  namespace: monitor
LDAP
If you need to use LDAP for unified login, LDAP configuration needs to be set up:
1ldap:
2  ##  ldap.enabled Enable LDAP for Grafana
3  ##
4  enabled: true
5  ##  ldap.secretName Name of the Secret with the ldap.toml configuration file for Grafana
6  ## NOTE: When it's set the ldap.configuration parameter is ignored
7  ##
8  secretName: "grafana-ldap"
ldap.toml
 1[[servers]]
 2# Ldap server host (specify multiple hosts space separated)
 3host = "ldap.my_secure_remote_server.org"
 4# Default port is 389 or 636 if use_ssl = true
 5port = 636
 6# Set to true if LDAP server should use an encrypted TLS connection (either with STARTTLS or LDAPS)
 7use_ssl = true
 8# If set to true, use LDAP with STARTTLS instead of LDAPS
 9start_tls = false
10# set to true if you want to skip SSL cert validation
11ssl_skip_verify = false
12# set to the path to your root CA certificate or leave unset to use system defaults
13# root_ca_cert = "/path/to/certificate.crt"
14# Authentication against LDAP servers requiring client certificates
15# client_cert = "/path/to/client.crt"
16# client_key = "/path/to/client.key"
17
18# Search user bind dn
19bind_dn = "cn=admin,dc=grafana,dc=org"
20# Search user bind password
21# If the password contains # or ; you have to wrap it with triple quotes. Ex """#password;"""
22bind_password = "grafana"
23# We recommend using variable expansion for the bind_password, for more info https://grafana.com/docs/grafana/latest/setup-grafana/configure-grafana/#variable-expansion
24# bind_password = '$__env{LDAP_BIND_PASSWORD}'
25
26# Timeout in seconds. Applies to each host specified in the 'host' entry (space separated).
27timeout = 10
28
29# User search filter, for example "(cn=%s)" or "(sAMAccountName=%s)" or "(uid=%s)"
30# Allow login from email or username, example "(|(sAMAccountName=%s)(userPrincipalName=%s))"
31search_filter = "(cn=%s)"
32
33# An array of base dns to search through
34search_base_dns = ["dc=grafana,dc=org"]
35
36# group_search_filter = "(&(objectClass=posixGroup)(memberUid=%s))"
37# group_search_filter_user_attribute = "distinguishedName"
38# group_search_base_dns = ["ou=groups,dc=grafana,dc=org"]
39
40# Specify names of the LDAP attributes your LDAP uses
41[servers.attributes]
42member_of = "memberOf"
43email =  "email"
1kubectl create secret generic grafana-ldap --from-file=ldap.toml=ldap.toml
Installation
Run the following command to install Grafana using Helm and the values.yaml file:
1helm install ${RELEASE_NAME} bitnami/grafana -f values.yaml
The following output will be displayed:
 1CHART NAME: grafana
 2CHART VERSION: x.x.x
 3APP VERSION: x.x.x
 4
 5** Please be patient while the chart is being deployed **
 6
 71.  Get the application URL by running these commands:
 8    echo "Browse to [http://127.0.0.1:8080](http://127.0.0.1:8080/)"
 9    kubectl port-forward svc/grafana 8080:3000 &
10
112.  Get the admin credentials:
12
13    echo "User: admin"
14    echo "Password: $(kubectl get secret grafana-admin --namespace monitor -o jsonpath="{.data.GF_SECURITY_ADMIN_PASSWORD}" | base64 -d)"
If LDAP is used, simply use your LDAP account and password to log in.
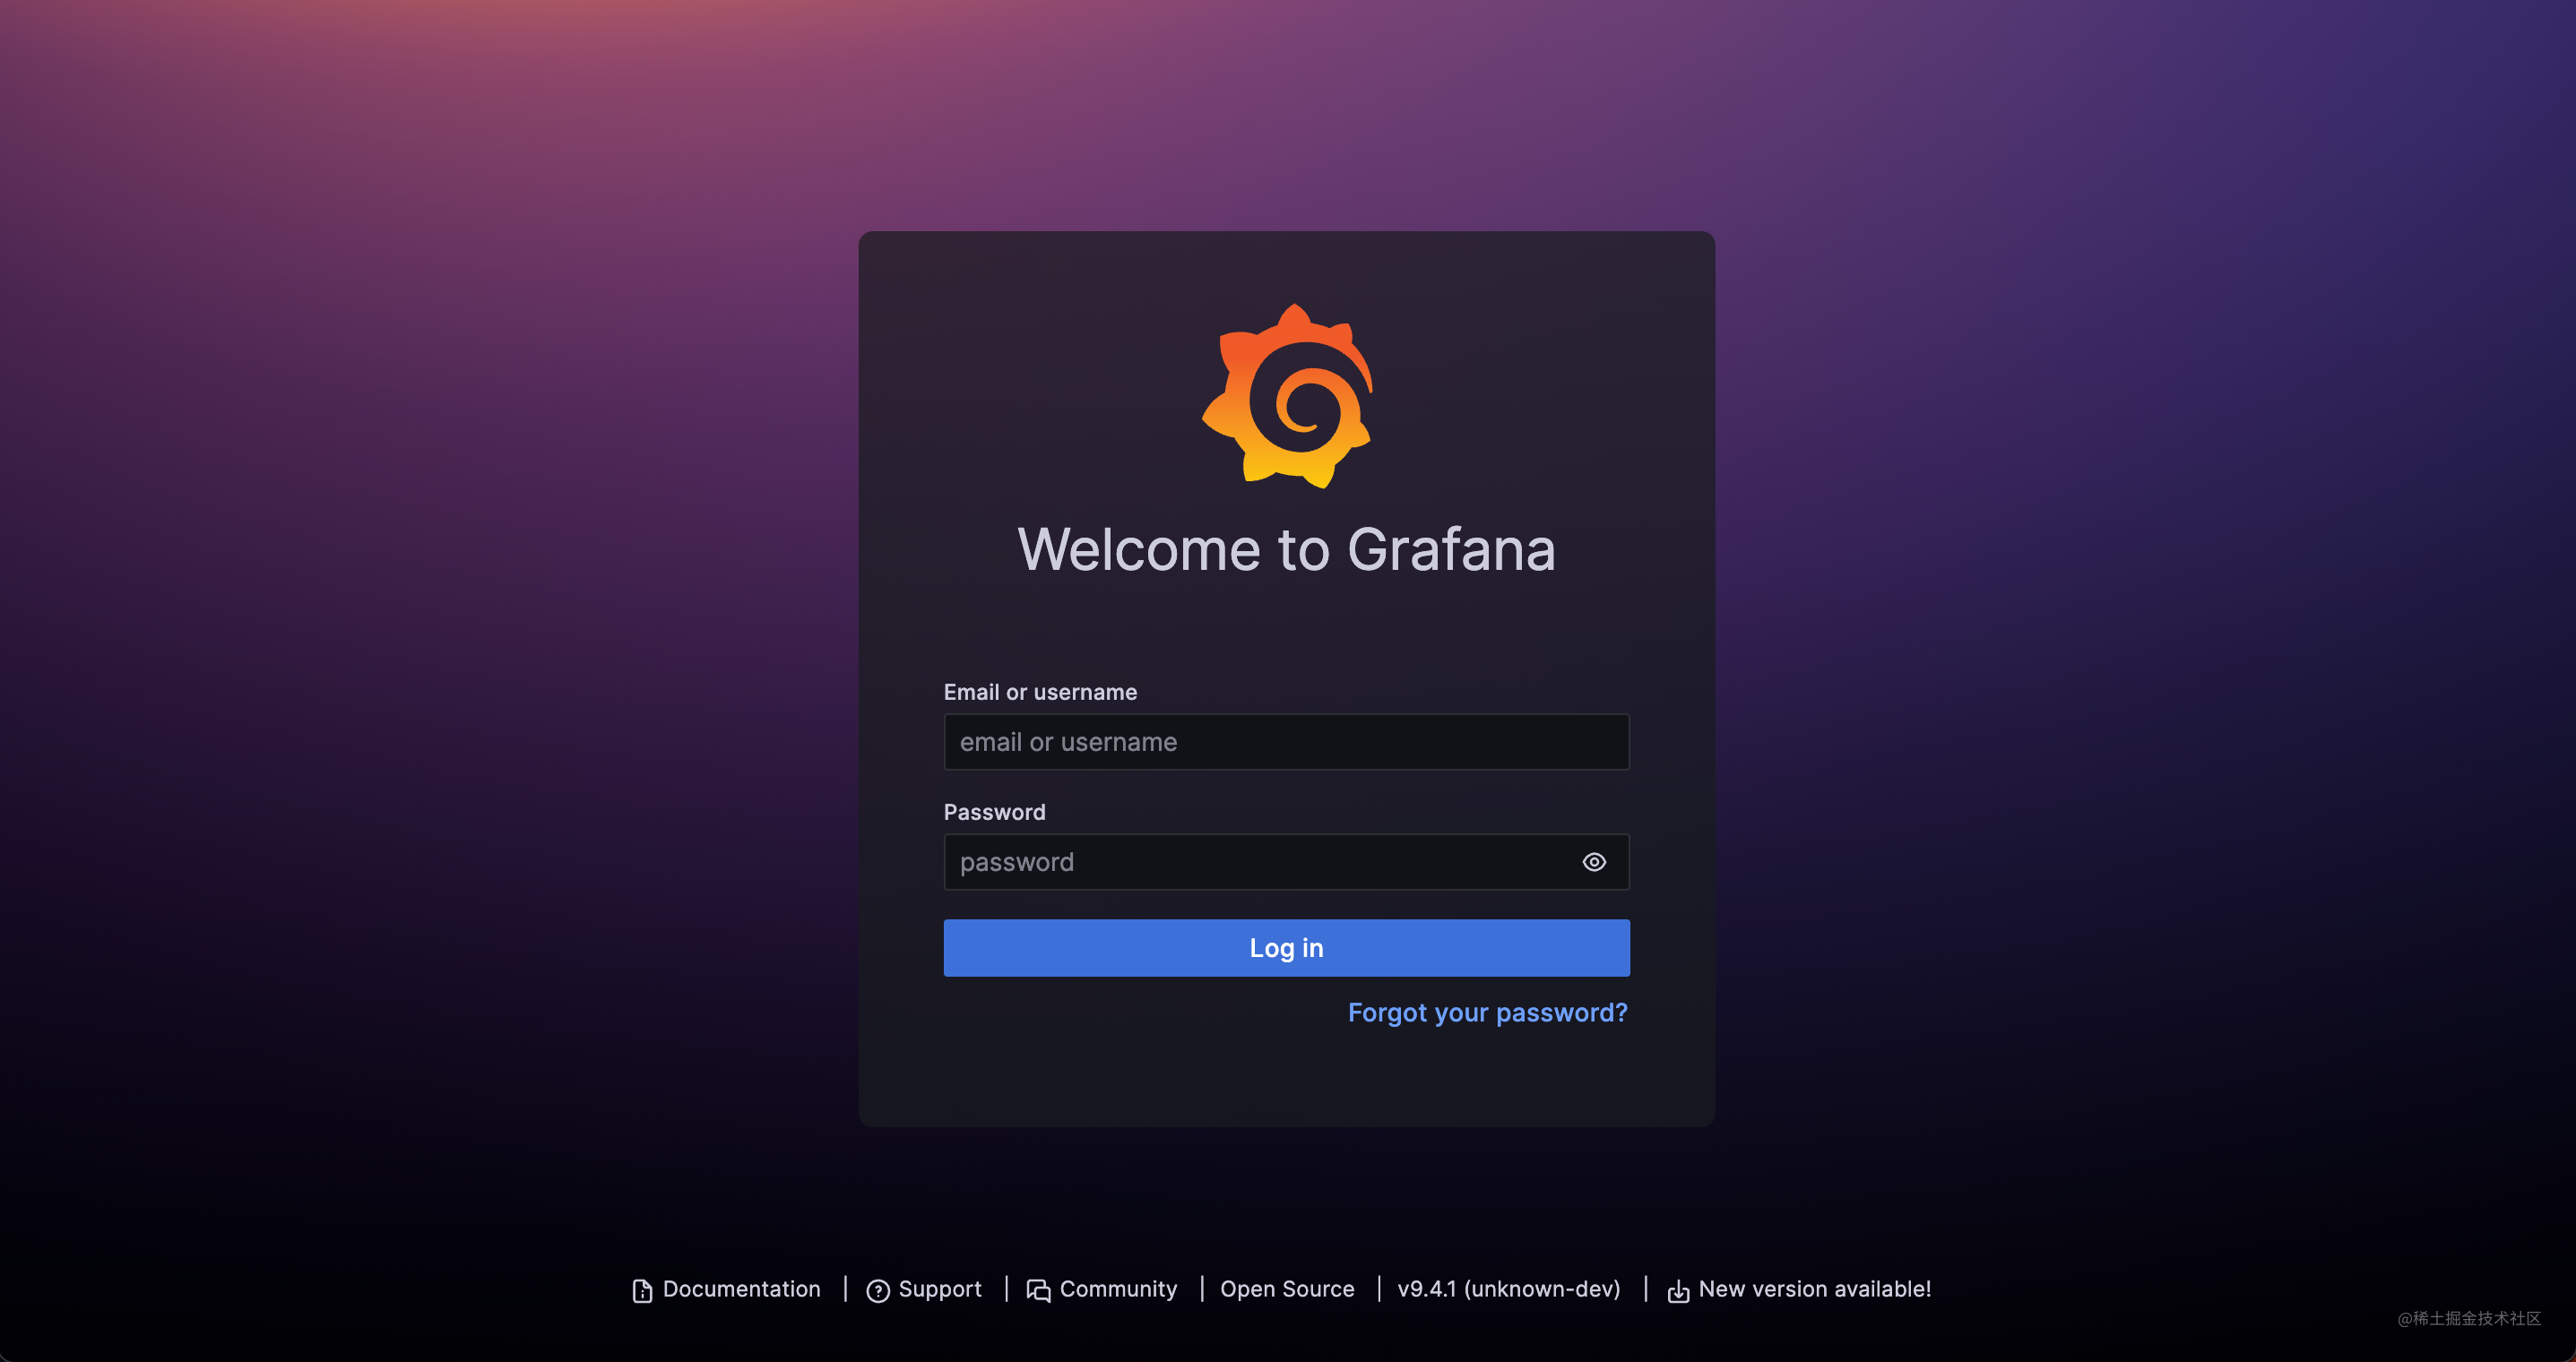
Result
